Lecture 12
Sketching using Tikz
Tikz is a package in LaTeX to draw professional-looking drawings.
Import package
We need to import Tikz package first.
\usepackage{tikz}
We can either make our drawings in our LaTeX documents directly or we can make the drawings outside of the documents and import to LaTeX as PDF files using includegraphics function.
To make the drawings outside an appropriate document class is standalone. We can open it as follows.
\documentclass[tikz, margin=2mm]{standalone}
In this tutorial, the drawings will be made in the LaTeX documents.
We can draw simple shapes as follows:
Lines
\documentclass{article}
\usepackage{tikz}

\begin{document}
\begin{figure}
\begin{tikzpicture}

\draw (0,0) -- (4,0);

\end{tikzpicture}
\end{figure}
\end{document}
Rectangles
\documentclass{article}
\usepackage{tikz}

\begin{document}
\begin{figure}
\begin{tikzpicture}

\draw (0,0) rectangle (4,2);

\end{tikzpicture}
\end{figure}
\end{document}
Circles
\documentclass{article}
\usepackage{tikz}

\begin{document}
\begin{figure}
\begin{tikzpicture}

\draw (0,0) circle (4cm);

\end{tikzpicture}
\end{figure}
\end{document}
Ellipses
\documentclass{article}
\usepackage{tikz}

\begin{document}
\begin{figure}
\begin{tikzpicture}

\draw (0,0) ellipse (4cm and 2cm);

\end{tikzpicture}
\end{figure}
\end{document}
B-splines
\documentclass{article}
\usepackage{tikz}

\begin{document}
\begin{figure}
\begin{tikzpicture}

\draw (0,0) .. controls (1,-1) and (2,1) .. (3,0);

\end{tikzpicture}
\end{figure}
\end{document}
Line shape and colors
\documentclass{article}
\usepackage{tikz}
\usepackage{xcolor}

\begin{figure}[ht]
\centering
\begin{tikzpicture}
\draw[line width=1pt, brown!50!yellow] (5,0) ellipse (2cm and 3cm);
\draw[line width=2pt, black!53!blue!90!white, dotted] (0,0) ellipse (3cm and 2cm);
\end{tikzpicture}
\end{figure}
\end{document}
Arrows
\documentclass{article}
\usepackage{tikz}
\usepackage{xcolor}

\begin{figure}[ht]
\centering
\begin{tikzpicture}
\draw[->] (0,0) -- (6,0);
\draw[-latex] (0,-2) -- (6,-2);
\draw[-stealth] (0,-4) -- (6,-4);
\end{tikzpicture}
\end{figure}
\end{document}
Nodes
\documentclass{article}
\usepackage{tikz}
\usepackage{xcolor}

\begin{figure}[ht]
\centering
\begin{tikzpicture}
\draw[-latex] (0,0) -- (6,0) node[right]{$x_1$};
\draw[-latex] (0,0) -- (0,6) node[above]{$x_2$};
\end{tikzpicture}
\end{figure}
\end{document}
Define variables
\documentclass{article}
\usepackage{tikz}
\usepackage{xcolor}

\begin{figure}[ht]
\centering
\begin{tikzpicture}
\draw[-latex] (0,0) -- (6,0) node[right]{$x_1$};
\draw[-latex] (0,0) -- (0,6) node[above]{$x_2$};
\def\x{-0.4}
\def\y{-0.4}
\node at (\x,\y) {$(0,0)$};
\node at ( 1.0,\y) {$1$};
\node at ( 2.0,\y) {$2$};
\node at ( 3.0,\y) {$3$};
\node at ( 4.0,\y) {$4$};
\node at ( 5.0,\y) {$5$};
\draw (1,0.1) -- (1,-0.1);
\draw (2,0.1) -- (2,-0.1);
\draw (3,0.1) -- (3,-0.1);
\draw (4,0.1) -- (4,-0.1);
\draw (5,0.1) -- (5,-0.1);
\end{tikzpicture}
\end{figure}
\end{document}
For loops with foreach function
\documentclass{article}
\usepackage{tikz}
\usepackage{xcolor}

\begin{figure}[ht]
\centering
\begin{tikzpicture}
\draw[-latex] (0,0) -- (6,0) node[right]{$x_1$};
\draw[-latex] (0,0) -- (0,6) node[above]{$x_2$};
\def\x{-0.4}
\def\y{-0.4}
\node at (\x,\y) {$(0,0)$};
\node at ( 1.0,\y) {$1$};
\node at ( 2.0,\y) {$2$};
\node at ( 3.0,\y) {$3$};
\node at ( 4.0,\y) {$4$};
\node at ( 5.0,\y) {$5$};
\draw (1,0.1) -- (1,-0.1);
\draw (2,0.1) -- (2,-0.1);
\draw (3,0.1) -- (3,-0.1);
\draw (4,0.1) -- (4,-0.1);
\draw (5,0.1) -- (5,-0.1);

\foreach \y in {1,2,3,4,5}
\node at (\x, \y) {$\y$};
\foreach \y in {1,2,3,4,5}
\draw (0.1,\y) -- (-0.1,\y);
\end{tikzpicture}
\end{figure}

\begin{figure}[ht]
\centering
\begin{tikzpicture}
\foreach \y in {-3,-2,-1,0,1,2,3,4,5,6}
  \draw (1,\y) -- (-1,\y);
\end{tikzpicture}
\caption{These are lines (foreach)}
\end{figure}

\begin{figure}[ht]
\centering
\begin{tikzpicture}
\foreach \y in {-3,-2,-1,0,1,2,3,4,5,6}
  \draw ( 1,\y) -- (-1,\y);
\foreach \y in {-3,-2,-1,0,1,2,3,4,5,6}
  \node at (0,\y+0.2) {$\y$};
\end{tikzpicture}
\caption{These are lines with numbers}
\end{figure}

\end{document}
Grid lines
\documentclass{article}
\usepackage{tikz}
\usepackage{xcolor}

\begin{figure}[ht]
\centering
\begin{tikzpicture}
%\draw[step=0.1cm, gray!50!white, line width=0.5pt] (-3,-3) grid (6,6);
%\draw[step=1cm, gray, line width=0.5pt] (-3,-3) grid (6,6);
%\foreach \y in {-3,-2,-1,0,1,2,3,4,5,6}
%  \draw (1pt,\y cm) -- (-1pt,\y cm) node[anchor=east] {$\y$};
%\foreach \x in {-3,-2,-1,0,1,2,3,4,5,6}
%  \draw (\x cm,1pt) -- (\x cm,-1pt) node[anchor=north] {$\x$};
\draw[fill=red] (2.2,2.2) circle (1mm);
\draw[fill=black] (-2.2,-2.2) circle (1mm);
\draw[line width=1pt, brown!50!yellow] (0,0) ellipse (2cm and 3cm);
\end{tikzpicture}
\caption{This is a grid}
\end{figure}
\end{document}
An example document
\documentclass{article}
%\documentclass{standalone}
\usepackage{tikz}
\usepackage{xcolor}

\begin{document}

\begin{figure}[h]
\begin{center}
\begin{tikzpicture}
\draw (0.0, 0.0)
-- (3.5, 0.0)
-- (3.5, 2.0)
-- (4.5, 2.0)
-- (4.5, 4.0)
-- (3.5, 4.0)
-- (3.5, 5.0)
-- (3.0, 5.0)
-- (3.0, 0.5)
-- (0.5, 0.5)
-- (0.5, 5.0)
-- (0.0, 5.0)
-- (0.0, 0.0)
;
\draw (3.5, 2.5) rectangle (4.0, 3.5);
\end{tikzpicture}
\caption{Schematic of the heat transfer problem. Geometry}
\label{fig:problem}
\end{center}
\end{figure}

Schematic of the heat transfer probelm is shown in Figure~\ref{fig:problem}.

\begin{figure}[h]
\begin{center}
\begin{tikzpicture}
\draw (0.0, 0.0)
-- (3.5, 0.0)
-- (3.5, 2.0)
-- (4.5, 2.0)
-- (4.5, 4.0)
-- (3.5, 4.0)
-- (3.5, 5.0)
-- (3.0, 5.0)
-- (3.0, 0.5)
-- (0.5, 0.5)
-- (0.5, 5.0)
-- (0.0, 5.0)
-- (0.0, 0.0)
;
\draw (3.5, 2.5) rectangle (4.0, 3.5);
\draw[latex-latex] ( 0.0,-0.1) -- ( 3.5,-0.1);
\draw[latex-latex] ( 3.6, 0.0) -- ( 3.6, 2.0);
\draw[latex-latex] ( 4.6, 2.0) -- ( 4.6, 4.0);
\draw[latex-latex] ( 4.1, 2.5) -- ( 4.1, 3.5);
\draw[latex-latex] (-0.1, 0.0) -- (-0.1, 5.0);
\draw[latex-latex] ( 0.0, 5.1) -- ( 0.5, 5.1);
\draw[latex-latex] ( 0.0, 5.1) -- ( 0.5, 5.1);
\draw[latex-latex] ( 3.5, 4.1) -- ( 4.5, 4.1);
\draw[latex-latex] ( 3.5, 3.6) -- ( 4.0, 3.6);
\end{tikzpicture}
\caption{Schematic of the heat transfer problem. Arrows}
\label{fig:problem_geo}
\end{center}
\end{figure}

\begin{figure}[h]
\begin{center}
\begin{tikzpicture}
\draw (0.0, 0.0)
-- (3.5, 0.0)
-- (3.5, 2.0)
-- (4.5, 2.0)
-- (4.5, 4.0)
-- (3.5, 4.0)
-- (3.5, 5.0)
-- (3.0, 5.0)
-- (3.0, 0.5)
-- (0.5, 0.5)
-- (0.5, 5.0)
-- (0.0, 5.0)
-- (0.0, 0.0)
;
\draw (3.5, 2.5) rectangle (4.0, 3.5);
\draw[latex-latex] ( 0.0,-0.1) -- ( 3.5,-0.1) node[below, midway]{$35$};
\draw[latex-latex] ( 3.6, 0.0) -- ( 3.6, 2.0) node[right, midway]{$20$};
\draw[latex-latex] ( 4.6, 2.0) -- ( 4.6, 4.0) node[right, midway]{$20$};
\draw[latex-latex] ( 4.1, 2.5) -- ( 4.1, 3.5) node[right, midway, inner sep=0mm]{$10$};
\draw[latex-latex] (-0.1, 0.0) -- (-0.1, 5.0) node[left, midway]{$50$};
\draw[latex-latex] ( 0.0, 5.1) -- ( 0.5, 5.1) node[above, midway]{$5$};
\draw[latex-latex] ( 3.5, 4.1) -- ( 4.5, 4.1) node[above, midway]{$10$};
\draw[latex-latex] ( 3.5, 3.6) -- ( 4.0, 3.6) node[above, midway]{$5$};
\end{tikzpicture}
\caption{Schematic of the heat transfer problem. Sizes}
\label{fig:problem_geo_with_numbers}
\end{center}
\end{figure}

\begin{figure}[h]
\begin{center}
\begin{tikzpicture}
\draw[blue!10!white, fill=blue!10!white] (0.5, 0.5) rectangle (3.0, 5.0);
\node at (1.75,4.5) {Water};
\node at (1.75,4.0) {$89^\circ\mathrm{C}$};
\node at (1.75,5.6) {Room temp.: $22^\circ\mathrm{C}$};
\draw (0.0, 0.0)
-- (3.5, 0.0)
-- (3.5, 2.0)
-- (4.5, 2.0)
-- (4.5, 4.0)
-- (3.5, 4.0)
-- (3.5, 5.0)
-- (3.0, 5.0)
-- (3.0, 0.5)
-- (0.5, 0.5)
-- (0.5, 5.0)
-- (0.0, 5.0)
-- (0.0, 0.0)
;
\draw (3.5, 2.5) rectangle (4.0, 3.5);
\draw[latex-latex] ( 0.0,-0.1) -- ( 3.5,-0.1) node[below, midway]{$35$};
\draw[latex-latex] ( 3.6, 0.0) -- ( 3.6, 2.0) node[right, midway]{$20$};
\draw[latex-latex] ( 4.6, 2.0) -- ( 4.6, 4.0) node[right, midway]{$20$};
\draw[latex-latex] ( 4.1, 2.5) -- ( 4.1, 3.5) node[right, midway, inner sep=0mm]{$10$};
\draw[latex-latex] (-0.1, 0.0) -- (-0.1, 5.0) node[left, midway]{$50$};
\draw[latex-latex] ( 0.0, 5.1) -- ( 0.5, 5.1) node[above, midway]{$5$};
\draw[latex-latex] ( 3.5, 4.1) -- ( 4.5, 4.1) node[above, midway]{$10$};
\draw[latex-latex] ( 3.5, 3.6) -- ( 4.0, 3.6) node[above, midway]{$5$};
\end{tikzpicture}
\caption{Schematic of the heat transfer problem. Water}
\label{fig:problem_geo_with_numbers}
\end{center}
\end{figure}

\end{document}
Animations
\documentclass[tikz,margin=2mm]{standalone}
\usepackage{tikz}

\begin{document}

\foreach \x in {0,1,...,60,59,58,...,0}{
\begin{tikzpicture}

\draw[line width=1.5pt, blue!30!black, fill=white] (0,0) rectangle (6,4);
\draw[line width=0.5pt, red] (0,0) rectangle (\x/10,4);
\draw[line width=1.5pt, blue!30!black] (0,0) rectangle (6,4);

\end{tikzpicture}
}

\end{document}
Convert command possible error
You need to install imagemagick to use convert command to convert PDF to GIF.
sudo apt-get update
sudo apt-get install imagemagick
Then refresh your terminal.
If you get an error similar to
attempt to perform an operation not allowed by the security policy `PDF'
you need to follow below.
sudo vi /etc/ImageMagick-6/policy.xml
paste the line below just above </policymap> line:
<policy domain="module" rights="read|write" pattern="{PS,PDF,XPS}" /
You policy.xmf file should look like:
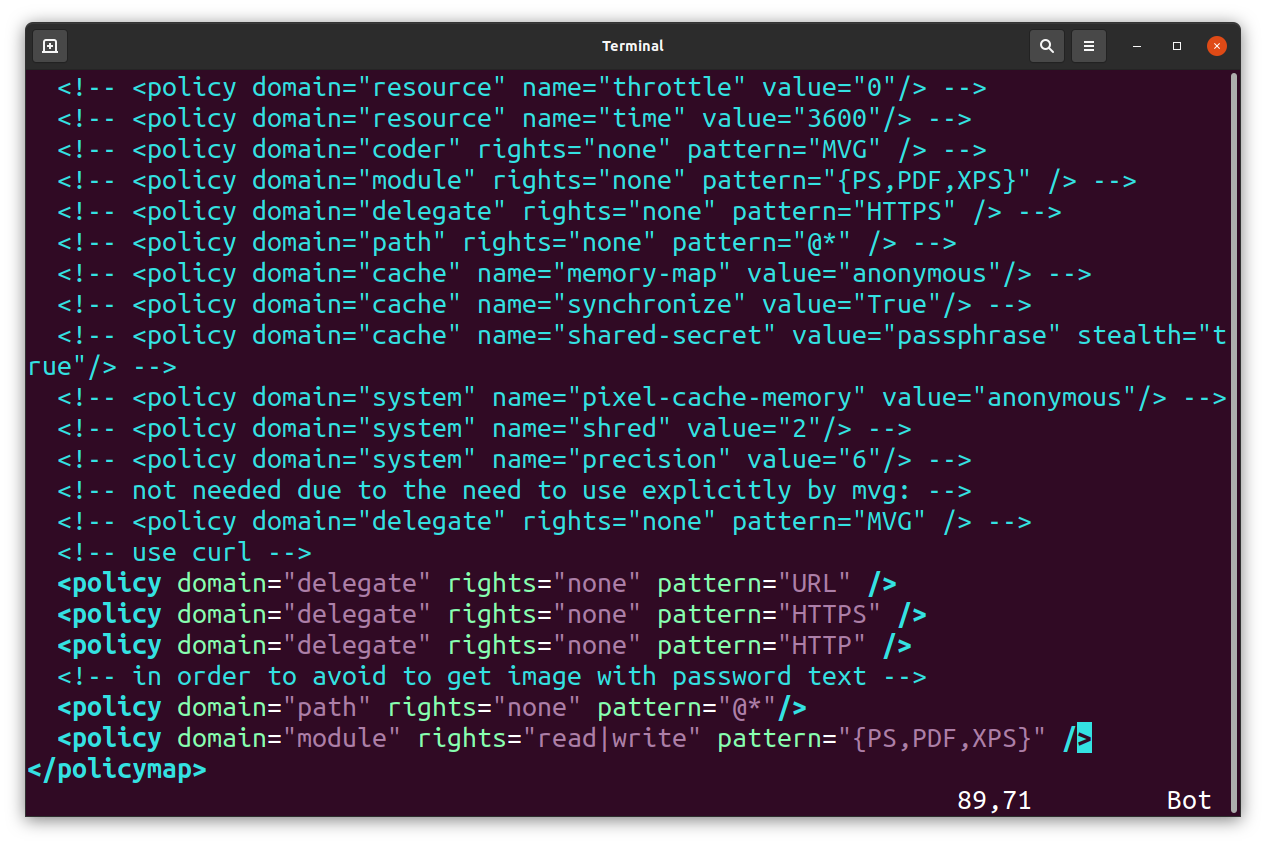
Here if you have the lines below, you should remove those:
<!-- disable ghostscript format types -->
<policy domain="coder" rights="none" pattern="PS" />
<policy domain="coder" rights="none" pattern="PS2" />
<policy domain="coder" rights="none" pattern="PS3" />
<policy domain="coder" rights="none" pattern="PSS" />
<policy domain="coder" rights="none" pattern="PDF" />
<policy domain="coder" rights="none" pattern="XPS" />